How have performance metrics, such as facing fill or network fill rates, developed over the past two decades?
There is little question that service levels have increased significantly for OEM parts distribution. As such, carmakers set performance objectives that are today much higher than 20 years ago. For example, most carmakers in the US consider the benchmark ‘facing fill rate’ – the percentage of dealer orders that can be served by standard order from its nearest regional parts centre – to be around 95%. For ‘system fill’, which is the ratio of orders that can be filled from across a given network (including rush orders), the ratio is now around 98%.
Advertisement
Kai Rabe says IT systems and more synchronised processes have supported significant improvements in meeting ever tougher service targets. Neil Swartz and Anu Goel also point to continuous improvements, although Swartz says it has been a challenge to increase such performance while integrating more part numbers and varieties into the supply chain.
Now that service levels are so high, there is some debate about the balance between availability and inventory. Anu Goel, for example, says that he considers a 94% facing fill rate to be a good level, even though some brands push this level as high as 96%. For system fill, he considers anything above 98% attributable to “luck”. Goel thinks there can be too much emphasis on increasing these numbers without consideration for inventory impacts.
With facing and system fill high enough to warrant debate over incremental changes, some are looking more at other indicators. David Carlisle says that these are typically based on retail and end-customer experiences, such as the time it takes to clear back orders, measuring lost sales at retail, repair order fill rates and ‘fix it right the first time’ rates at dealers.
Swartz says Toyota is working on enhancing the accuracy of its estimated delivery times order by order. Goel says there is a key effort to clear backlogs that could go back months or longer.
Have you expanded delivery service and frequency further, or will you?
Some carmakers have taken a lead in expanding multiple daily deliveries – although in truth such services are only just catching up to the frequency levels common for many independent parts distributors and retailers.
In the US, BMW and Toyota have added same-day services over the past few years – services for which they also charge dealers a monthly fee. Others, such as Ford, are encouraging larger dealers and distributors to develop same-day logistics capabilities, for example by holding inventory for smaller service centres or garages. Up to now, however, the carmaker has not moved to same-day deliveries to dealers directly.
In Europe, carmakers such as BMW, Mercedes-Benz and Volkswagen offer same-day services to select regions or countries, such as the UK and Germany. At Opel, Kai Rabe says that local distribution centres in Germany, Switzerland and part of Austria support same-day deliveries. Baumann confirms that BMW has also added same-day service to its densest markets in China.
In the US, Volkswagen Group is among those who have not yet implemented same-day service, though Goel recognises it could play an important role over the next decade. Short of large investments in new warehouses, he sees issues in how to offer such services only to a part of the network, for example by drawing maximum limits from a distribution centre.
Advertisement
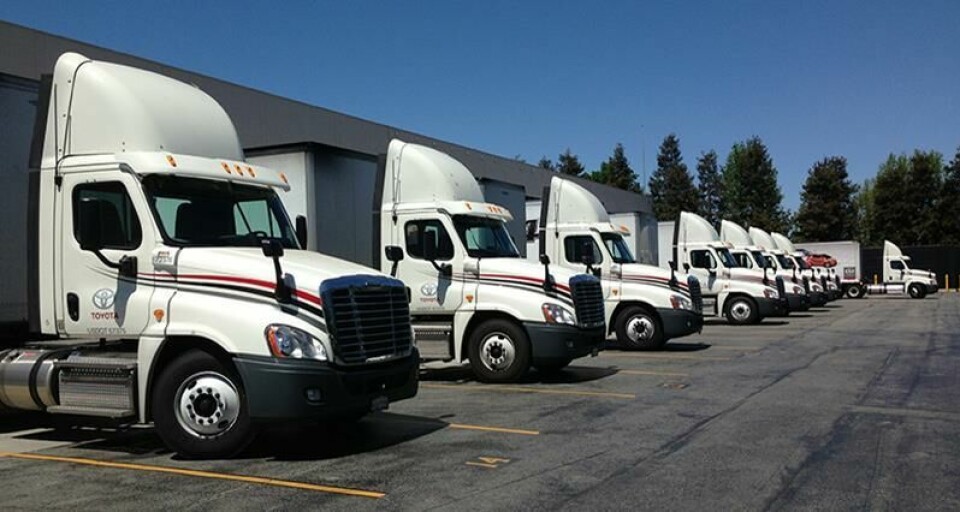
Other brands and their dealers do accept this differential. BMW, which started same-day service in Europe and the US in 2010, has opened five local distribution centres that offer same-day delivery to around half of the US market, says Baumann. Toyota, which started in the US in 2011, covers a similar proportion. In both cases, delivery levels have increased in popularity and will play an important role in the company’s future delivery strategies.
How much change has there been in the overall warehouse and distribution centre footprint and how might it develop further?
Carmakers are cautious about adding new warehouse space to avoid increasing their fixed costs
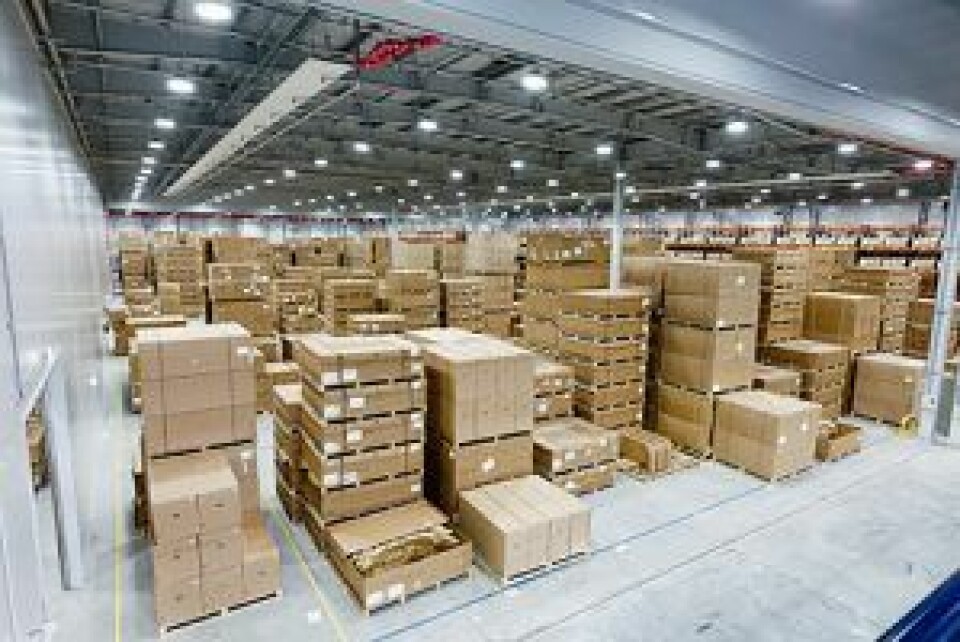
The past two decades have included notable investments in distribution centres for many carmakers, both in their central parts distribution centres and in regional warehouses. At BMW, growth in part numbers and global variety prompted the carmaker to build the ZTA in Dingolfing in 2005, with restructuring initiated in 2015 to improve efficiency further. Volkswagen Group has invested further in the OTC in Kassel, adding a number of new buildings and expanding space over the past decade.
Carmakers have expanded their presence in emerging markets over the past two decades, with many new distribution centres added in China, India and South America. BMW, as part of its global network restructuring, has recently opened new distribution centres in countries that include Malaysia, China, South Korea and South Africa.
In North America and Europe, carmakers have generally been careful about new warehouse space. However, the move towards shorter lead times and more frequent deliveries has led to an expansion in most OEM footprints. Anu Goel observes that Ford’s transition to overnight service led it to expand from 10 distribution centres in North America to 26 over several years. When Volkswagen Group made the switch several years ago, it increased from five to eight regional centres in around three years.
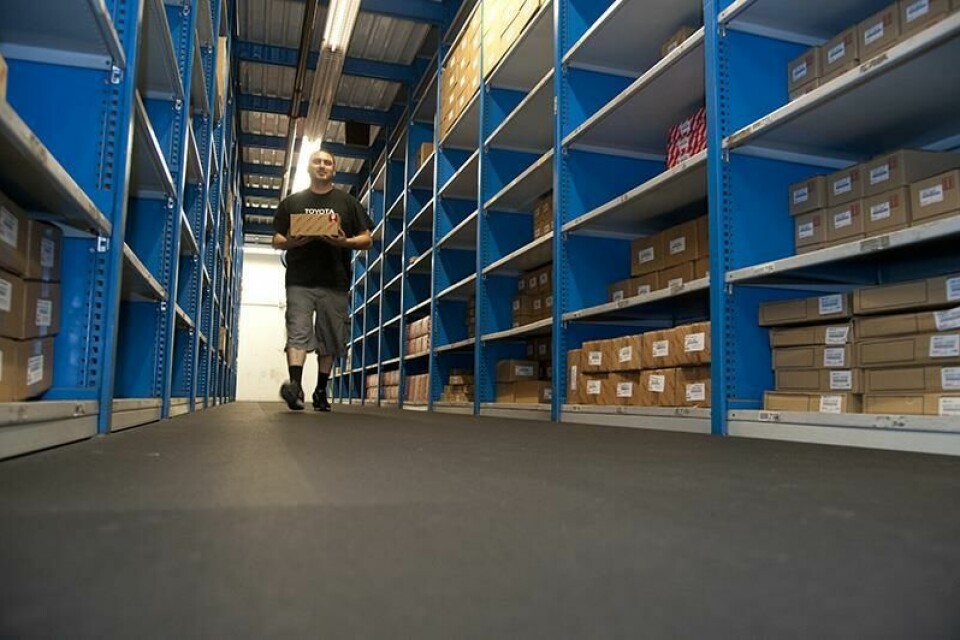
The move towards same-day service has again required investments in warehousing. BMW added five smaller, ‘dealer metro distribution centres’ (DMDCs) to support its six other parts and distribution centres in the US. Even Toyota, which had put most of its ‘two-tier’ network in place in the US by the 1990s and early 2000s, including its two main parts centres in California and Kentucky, saw a need to revisit its network as an opportunity to expand same-day service.
Current plans for new warehouses among OEMs are limited. For inbound supply to warehouses, BMW plans to add a China ConDC for inbound, and the North American ConDC will expand in phases over the next several years. However, Baumann says that BMW has finished its main distribution restructuring. And despite the recent spate of new distribution centres at the carmaker, many of these represent consolidation or changes from existing facilities. In the last two years, BMW has only added one net additional regional centre globally, and four since 2005 (excluding DMDCs). Opel, meanwhile, has built a large new parts distribution centre in Bochum, Germany. However, this is at the site of an assembly plant that it closed in recent years.
Advertisement
Anu Goel points out that adding fixed costs holds Volkswagen and others back from adding same-day services; he estimates that three new facilities to support such delivery would require part sales in excess of $75m per year in the US.
Further in the future, David Carlisle thinks it is even harder to guess what will happen with the distribution network, as developments in the shared economy and 3D printing, for example, may alter OEM footprints entirely. For now, however, it is too early to tell.
Are you running or considering more omnichannel distribution and logistics, such as home deliveries or deliveries to sites other than a dealership?
With e-commerce players moving into the aftermarket and distributors offering more flexible, low-cost or even digital services, carmakers are starting to explore delivering parts outside of traditional channels. Ford, PSA and others have expanded more into ‘all makes’ parts, for example, in efforts to gain business with independent garages. Others are pursuing e-commerce platforms and apps that could give customers options. David Carlisle thinks that Amazon will force everyone in the industry to look in this direction.
Such services can be complicated, especially as OEMs make efforts to keep their dealers at the centre of any transaction. Nevertheless, there are signs of change. Toyota, for example, is currently piloting a common e-commerce system through dealers with successful results, according to Neil Swartz, who says the company is studying how to include direct shipments to customers that might include car owners, repair shops or smaller garages – although sales will still be processed through dealers.
Anu Goel says Volkswagen already does specific shipments that go to locations outside dealerships, though still based on what dealers want. He predicts that for e-commerce platforms to grow for OEMs, however, dealers will have to accept changes to current sales terms and conditions – something he predicts many will resist.
What has been the biggest change in IT and software for service parts logistics?
In terms of aftermarket logistics IT, executives point to developments on the supply side, such as transport and inventory management systems, and those focused more on demand, such as ordering and inventory management. Both have seen improvements, though executives think the biggest developments are yet to come.
Kai Rabe recalls that, 20 years ago, most IT solutions were separate, split between supply chain, warehousing and transport, with relatively little integration. Today, systems run across entire enterprises and can help OEMs to optimise entire supply chains. However, he still thinks there is more to be done to connect systems, especially for transport.
Executives see scope in particular for cloud-based systems to support system integration and visibility.
Carlisle also thinks that the spread of retail inventory management (RIM) systems has been important. In the 1990s in the US, GM’s now-defunct Saturn brand was a leader in this area, using RIM to manage dealer parts inventory. This used to be considered a “greenfield-only process” for relatively new brands like Saturn, says Carlisle, but today many carmakers use it or are considering it.
Anu Goel at Volkswagen thinks RIM has a lot of potential. However one stumbling block in the US is in connecting such systems to the large variety of dealer management systems (DMS), he says. In the US, Volkswagen Group dealerships alone have 17 DMS, although two systems account for 80% of dealers. Goel thinks breakthroughs will happen once these systems are better integrated. Some carmakers are moving in this direction: Wolfgang Baumann says BMW is working on a global DMS to support dealer ordering and stock management.
Have you seen an increase, decrease or no change in the level of automation in your service parts logistics?
While large global parts distribution centres like the OTC or ZTA make use of sophisticated high-rack shelving, automated load-carrier warehouses and other types of logistics automation, the levels in regional distribution centre operations remain relatively low. Indeed, carmakers have generally retreated from earlier efforts at automation – such as large ‘carousels’ to move containers – in favour of the flexibility that human labour allows. Baumann says maintaining this flexibility was one reason BMW did not move to significantly more automation in its latest restructuring of the ZTA.
However, automation is still an important area of development, whether in autonomous transport systems or especially in logistics assistance, such as pick-by-voice and hands-free scanning. BMW, for example is testing scanner gloves for picking in Dingolfing, as well as AGVs in some warehouses. In future, David Carlisle thinks there could be artificial intelligence and e-enabled picking. Neil Swartz says that Toyota has shifted its thinking from generally focusing investments more on core processes. But he now sees opportunities to improve safety, quality and reduce waste through automation. Kai Rabe thinks further connectivity will play a major role in automating processes further.
How might data collection directly from connected vehicles change your service parts logistics in future?
Connected cars offer further scope to improve service parts logistics. Already, carmakers are touting concepts whereby dealer appointments could be made directly in vehicle consoles or by apps, with the vehicles transmitting diagnostic information to dealers in advance so that technicians can review issues, prepare potential fixes and order the necessary parts in advance. Meanwhile, the vast amounts of driver and vehicle data that can be collected via vehicles also expands the scope for analytics to better predict which parts are likely to need replacements and when.
A number of carmakers are already quite advanced with in-vehicle telematics systems, notably GM, BMW, Hyundai Motors and others. However, many issues remain before this vision becomes reality, not least issues over data privacy and security. Anu Goel points out that many issues in a vehicle still cannot be detected by remote diagnostic tests, and so ordering parts early for one set of issues might not save time if technicians uncover more once the vehicle physically arrives. Other executives see potential, but are unwilling to bet on when this connectivity might transform service parts logistics, if at all.